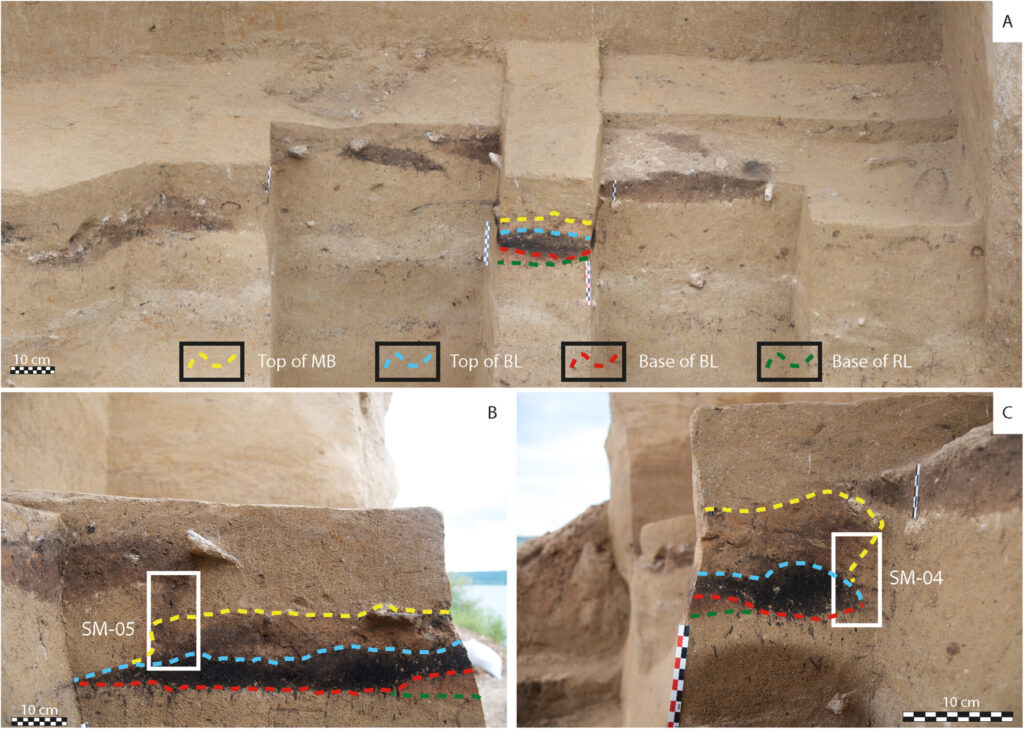
Korman’ 9, Trench 13-1, AL I, CF1: (A) Orthophotograph of CF1 model during Phase 3 of the excavation (after the removal of SM-01, SM-02 and SM-03 and exposure of new sections). The dark brown patches visible in the section are solifluction lobes. The two lower photographs show the left (B) and right (C) profiles of CF1. Model created by W.C. Murphree; photographs by P. R. Nigst. Scale in each photo is 10 cm. The white boxes indicate the sample location of micromorphology samples SM-05 (B) and SM-04 (C). The four dashed lines indicate the different deposits of the combustion feature: yellow = top of the mottled brown (MB) deposit, light blue = the top of the black layer (BL), red = the base of the BL and green indicates the base of the red layer (RL). (Philip R. Nigst)
Översikt och sammanhang
Denna forskningsartikel presenterar en högupplöst geoarkeologisk studie av tre härdar (eldstäder) från den övre paleolitiska platsen Korman’ 9, belägen vid Dnjestrfloden i Ukraina. Platsen är kopplad till epigravettianska bosättningar under den senaste istidens maximum (LGM), en period av extrem kyla och resursbrist i Eurasien, ungefär 26 500 till 19 000 år sedan.
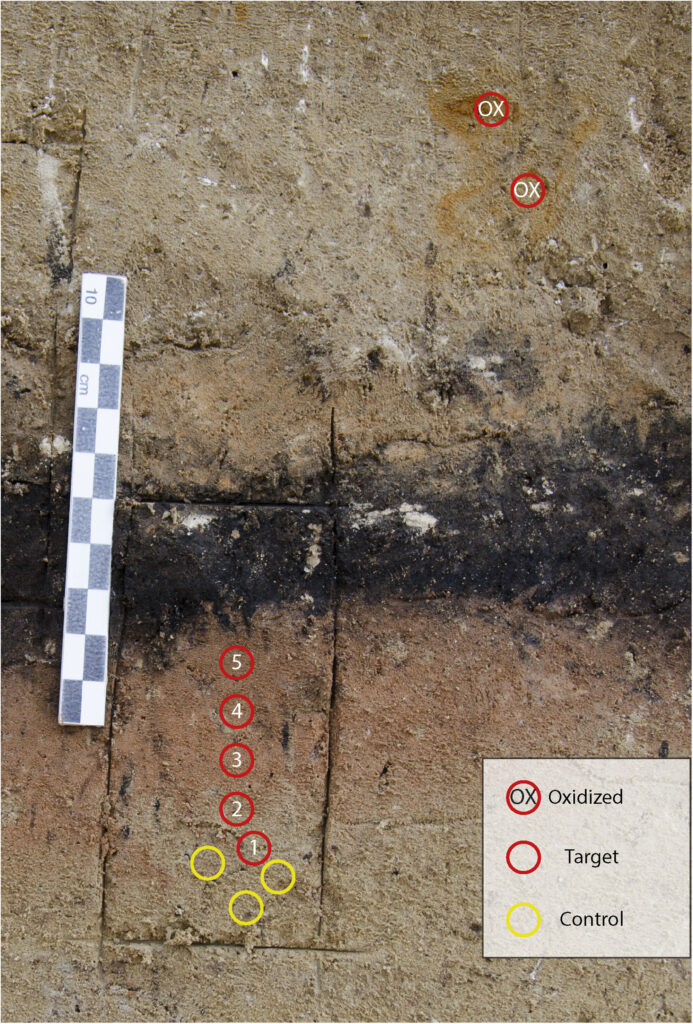
Colorimetric analysis for CF1. Location of the target (red circles), control (yellow), and oxidized sediments (OX) characterized in the analysis. Note the white mottles in the sediments corresponding to secondary Ca precipitates, and the orange colours, which correspond to higher amounts of Fe oxides. (Philip R. Nigst)
Viktiga fynd
Det finns få välbevarade och välbeskrivna härdar från LGM i Europa, trots att elden var avgörande för överlevnad i det kalla klimatet. Korman’ 9 ger några av de första detaljerade mikromorfologiska beskrivningarna av sådana eldstäder från denna period.
De tre analyserade härdarna var öppna, platta eldstäder som främst eldades med ved – kolanalys visar att gran var ett vanligt bränsle. Det finns också tecken på att djurben och möjligen fett brändes, antingen som extra bränsle eller av misstag, vilket är logiskt i en miljö där ved var en bristvara.
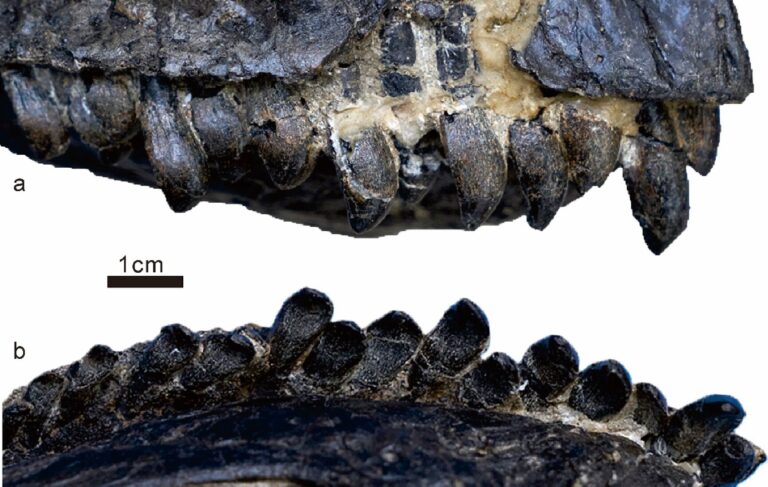
Färg- och temperaturanalys av sedimenten under härdarna visar att temperaturer på upp till 600°C uppnåddes, vilket stämmer överens med vedeldade eldar. Vissa ben som hittats nära härdarna var brända vid över 650°C, vilket tyder på exponering för hög värme.
Härdarna visar skillnader i storlek, struktur och organiskt innehåll, vilket kan spegla antingen flera bosättningar inom samma lager eller olika användningsområden under en och samma bosättning. Den rumsliga organisationen och återanvändningen av platsen tyder på långsiktig planering och möjligen säsongsbunden återkomst.
Bevarandet av härdarna har påverkats av solifluktionsprocesser (jordrörelser orsakade av frost och tö) och bioturbation (störningar av växter och djur), vilket har förändrat de ursprungliga strukturerna och sammansättningen av eldstäderna.
Studien belyser hur arbetskrävande eldhantering var och dess centrala roll i jägar-samlar-samhällen under övre paleolitikum – inte bara för värme, utan även för matlagning, verktygstillverkning och sociala aktiviteter. Fynden visar att människor även under de tuffaste klimatförhållandena upprätthöll avancerade eldtekniker och anpassade sitt eldbruk efter lokala miljöförhållanden.
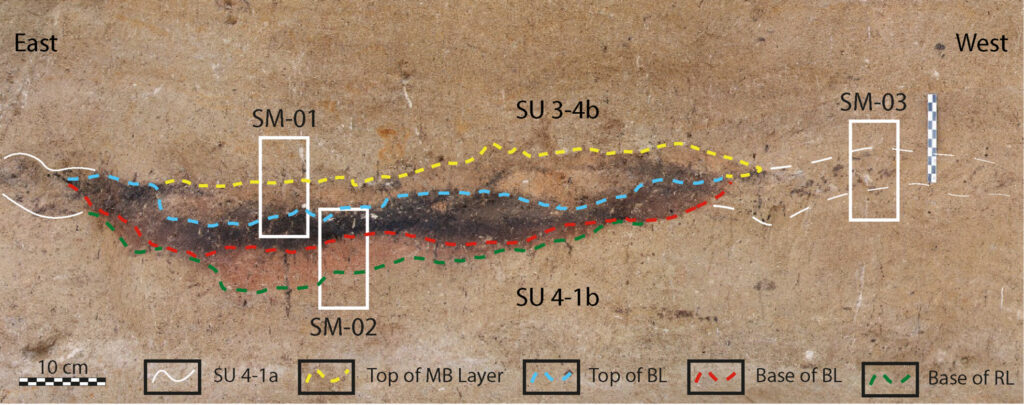
Korman’ 9, Trench 13-1, AL I, CF1: Annotated orthophotograph of the CF1 based on the Phase 0 model (cleaned section before excavation). Scale is 10 cm. The white boxes show the location for soil micromorphology samples (SM-01, SM-02 and SM-03). The extent of SU 4-1a is shown in the white lines. SU 4-1a becomes less visible further to the west as indicated by the dashed white lines. The four coloured dashed lines indicate the different contacts between the deposits of the combustion feature: yellow = top of the mottled brown (MB) deposit, light blue = top of the black layer (BL), red = the base of the BL and the green indicates the base of the red layer (RL). (Philip R. Nigst)
Betydelse
Härdarna vid Korman’ 9 ger sällsynt och detaljerad kunskap om eldbruk under LGM och fyller en lucka i det arkeologiska materialet. De visar att istidsmänniskor i Östeuropa var skickliga på att göra upp och underhålla eldar, använde tillgängliga resurser kreativt och organiserade sina boplatser kring denna viktiga teknik.
”Eld var inte bara till för att hålla värmen; den var också avgörande för matlagning, verktygstillverkning och sociala sammankomster,” säger Dr. Philip R. Nigst, arkeolog vid Wiens universitet.
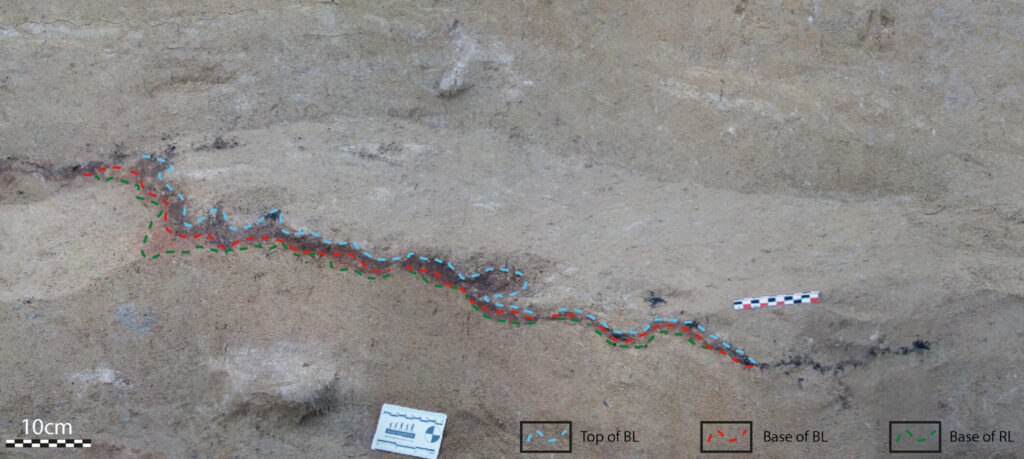
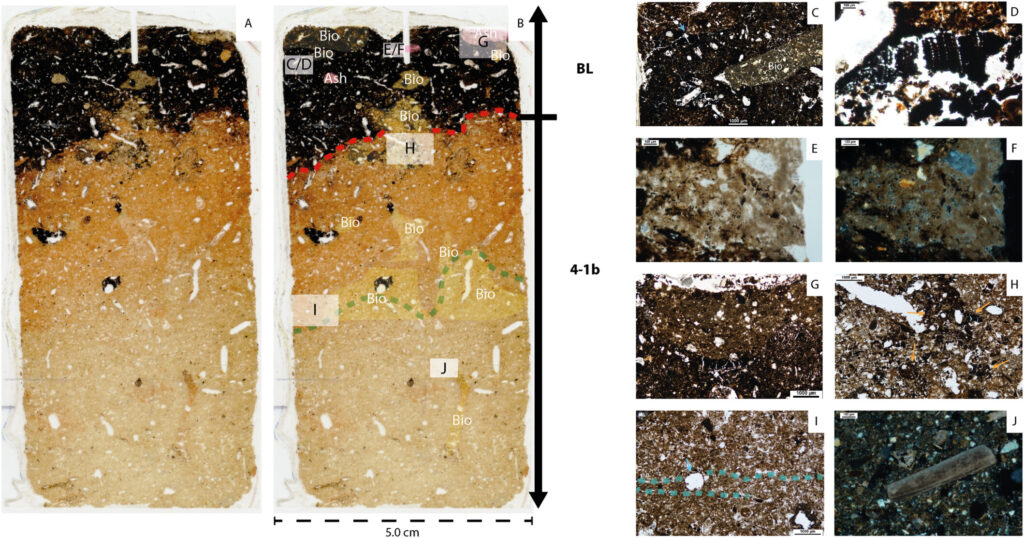
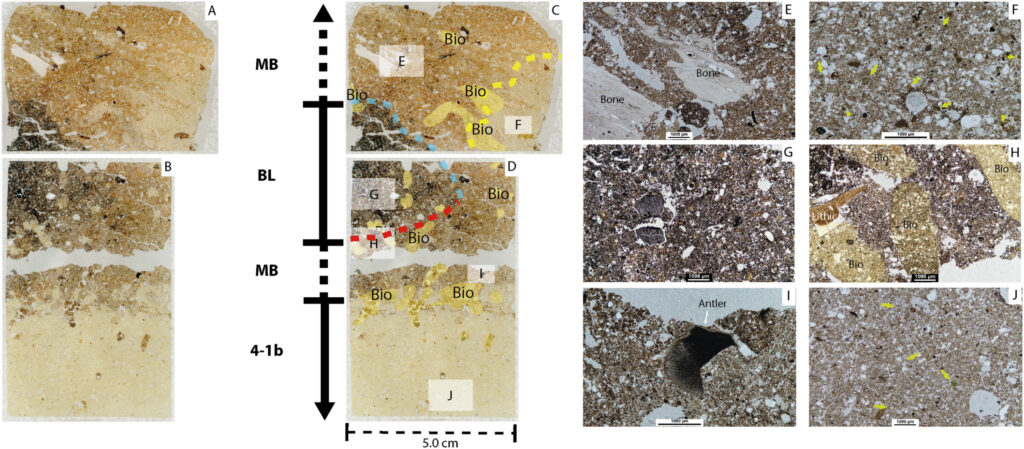
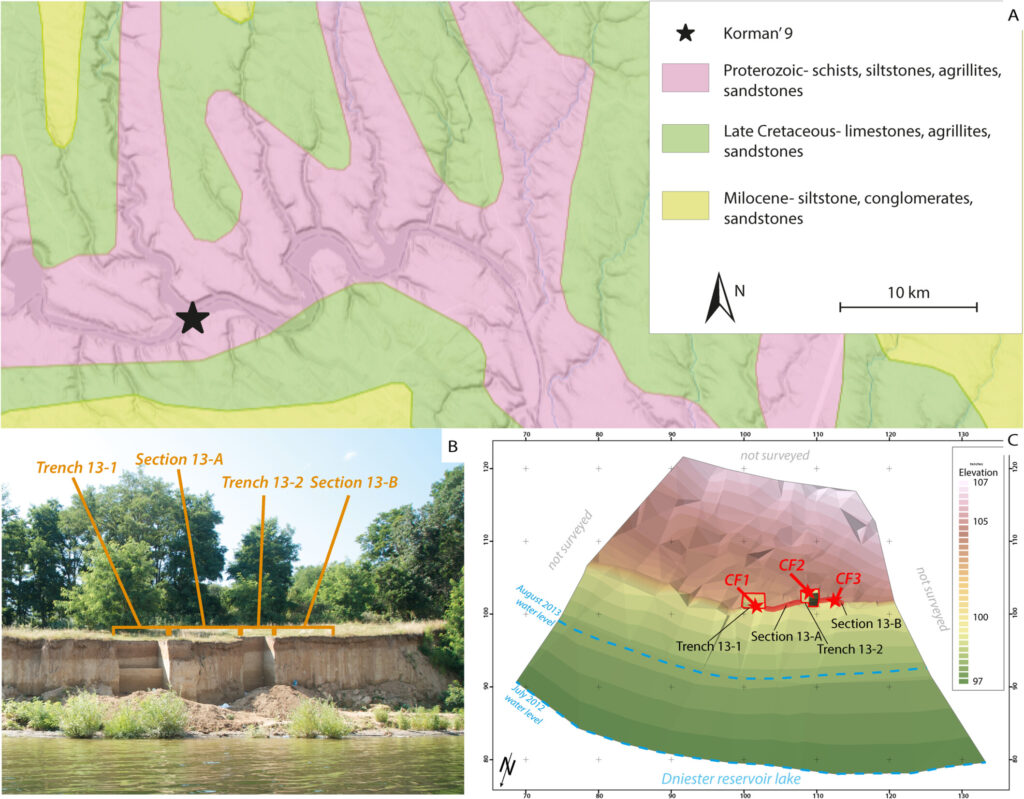
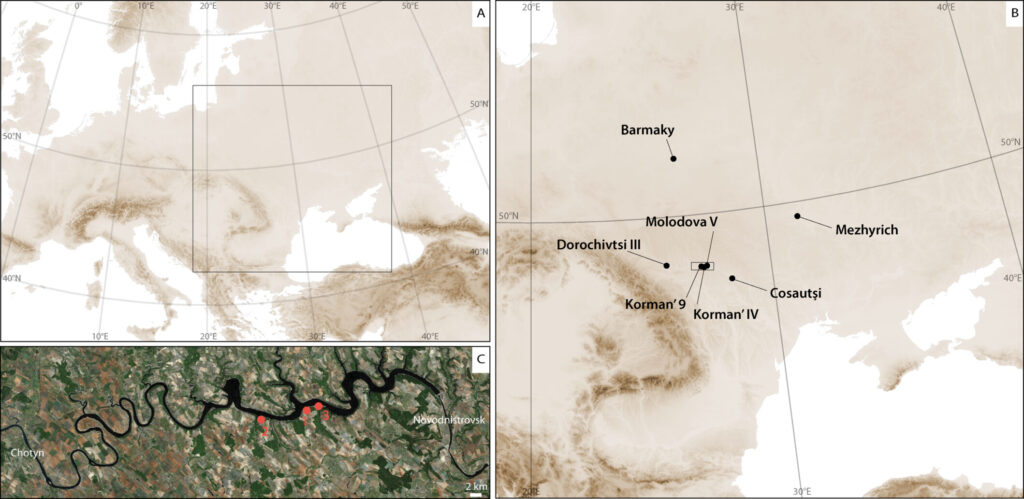
Korman’ 9, Section 13-B, AL II, CF3: View of the CF3 based on the model produced in Agisoft Metashape. The dashed lines indicate the various limits between the layers of CF3. The three lines indicate the different interfaces between the deposits of the combustion feature: light blue = the top of the BL, red = the base of the BL, and the green indicates the base of the RL. Model credit: W.C. Murphree.CF 1 from AL I in Trench 13-1: Thin sections and photomicrographs taken from SM-02. (A) The original thin section scans produced for SM-02. (B) Annotated thin section with the contacts between BL and RL (thermally altered SU 4-1b) (red line) overlying the unrubefied SU 4-1b sediments (green line). Bioturbated domains (Bio) are highlighted in yellow, and ash-rich domains (Ash) are highlighted in pink. Photomicrograph locations are shown in the white boxes. (C) Photomicrograph of burned plant remains found within the BL, PPL, scale is 1000 µm. Some of which (blue arrow) appear to be broken via frost action. Vermicular structures from soil fauna burrowing are highlighted in yellow. (D) Close up view of a charcoal shown in Figure 8C, PPL, scale is 100 µm. Note that the remains appear to be humified and not fully carbonized. (E) and (F) Small isolated ash domain found within the BL, in PPL (E) and XPL (F), scale is 100 µm. (G) Preserved ash domain within the BL, PPL, scale is 1000 µm. (H) Burned plant and organic remains (orange arrows) mixed within the RL due to bioturbation, PPL, scale is 1000 µm. (I) Weakly developed laminar/granular microstructures (light blue lines) and vesicles (blue arrow) associated with freeze-thaw affecting RL deposits, PPL scale is 1000 µm. (J) Shell fragment within SU 4-1b, XPL, scale is 100 µm. (Philip R. Nigst)CF1, AL I, Trench 13-1: Thin sections and photomicrographs taken from sample SM-04. Sample location shown in Figure 7C but further back into the section. Sections (A) and (B) are thin sections scans produced by Spectrum Petrographic. Sections (C) and (D) are the same image with annotations of the interfaces between MB and SU 3-4b deformed by solifluction (yellow line), MB and BL (light blue line) and RL (red line). Bioturbation (Bio) is highlighted in yellow, and the location of the photomicrographs shown to the right are indicated by the white boxes. (E) Photomicrograph of unburned bones found within MB deposit (SU 4-1a), PPL, scale is 1000 µm. (F) Photomicrograph of matrix of area marked in (c) showing of SU 3-4b showing moderately sorted with a common sand to fine sized quartz grains, massive microstructure with few void spaces, common silt-sized glauconite grains (yellow arrows) PPL, scale is 1000 µm. (G) Spongy microstructure of BL with abundant charcoals, PPL, scale is 1000 µm. (H) Partially burned lithic fragment within the MB deposit, bioturbation (highlighted in yellow) and contact with BL (demarked by the redline, PPL, scale is 1000 µm. (I) Partially burned bone/antler found within the MB deposit near the interface with the underlying SU 4-1b, PPL, scale is 1000 µm. (J) Well-sorted generally massive microstructure of the underlaying SU 4-1b, PPL, scale is 1000 µm. Glauconite grains are marked by light green arrows. (Philip R. Nigst)(A) Geological map of the Middle Dniester Valley with Korman’ 9 highlighted. Map source: Macrostrat (https://macrostrat.org/map/loc/27.1893/48.5749#z=8.7). (B) Site location on the Dniester River with the trenches and sections highlighted. (C) Digital elevation model for Korman’9 site. The locations of the combustion features are indicated by stars. Figure credit: W.C. Murphree & P.R. Nigst.(A) Map of Europe with the study area highlighted. (B) Map of study area with key LGM and Post-LGM sites with described combustion features highlighted. C) Onset map of Middle Dniester valley with the LGM sites of Korman’ 9 (1), Korman’ IV (3), and Moldova V (2) highlighted. Satellite image source: https://worldwind.arc.nasa.gov. Note the presence of a recent dam in C. Maps credit P.R. Nigst.
Referens Murphree, W.C., Ferro-Vázquez, C., Kulakovska, L., m.fl. (2025). Fire Use During the Last Glacial Maximum: Evidence From the Epigravettian at Korman’ 9, Middle Dniester Valley, Ukraine. Geoarchaeology, 40(2): e70006.